Analytics
📌 Overview
The Analytics page gives you a bird's-eye view of learner performance across your entire organization. You can see average performance, break down data by course or group, and track overall training health in one place.
Watch the tutorial video above
Overall Organization Performance
On the Analytics page, you can view the average performance of all learners across your organization.
The Organization tab provides a detailed breakdown of overall training data — completion rates, average scores, and engagement.
Filter by Course or Group
Use the Course tab to filter performance data for a specific course.
Use the Group tab to filter performance by a specific team or department.
This makes it easy to compare how different groups or courses are performing.
Build a Dashboard by Asking Quinn (Beta)
On the Analytics page you can ask Quinn a question in plain language or describe a dashboard, and Quinn either answers with live data or builds a custom, interactive dashboard from your training data.
Step 1: Open the Ask Quinn Bar
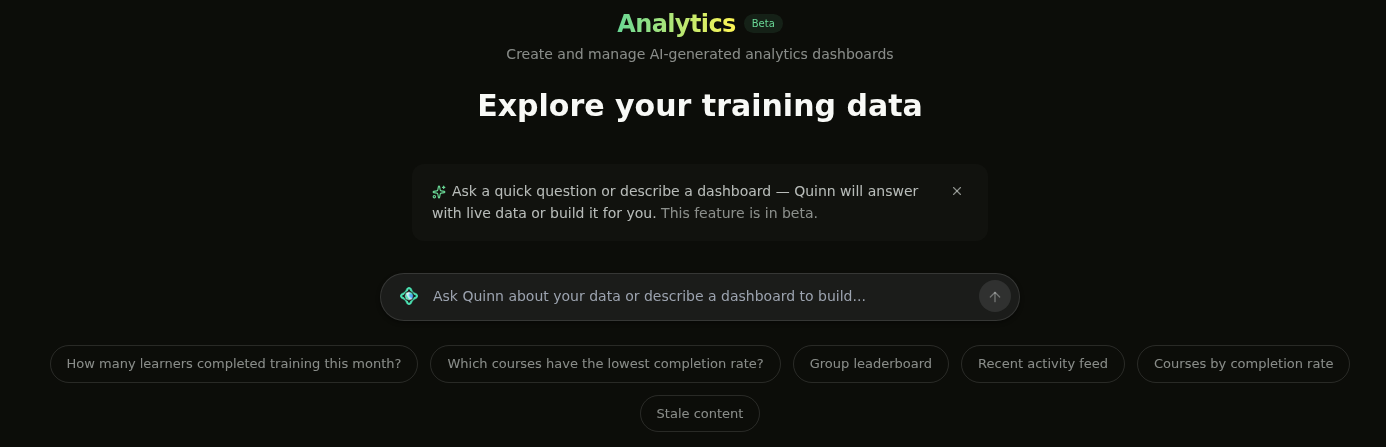
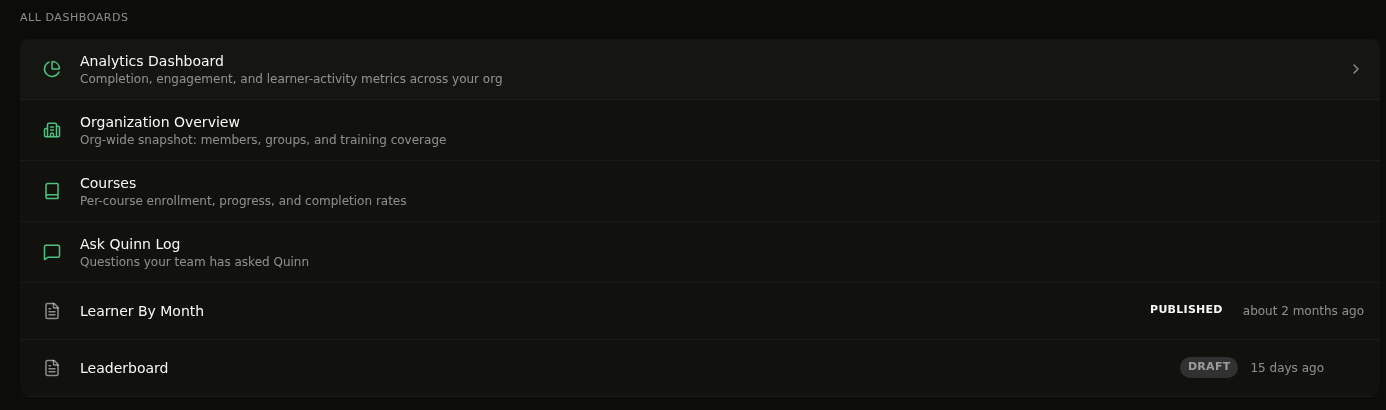
Go to Analytics. At the top of the page you'll see the Beta badge and a chat bar with the placeholder "Ask Quinn about your data or describe a dashboard to build..." Your existing dashboards are listed below under All Dashboards.
Step 2: Ask a Question or Describe a Dashboard
Type a question — like "How many learners completed training this month?" — to get a conversational answer, or describe a dashboard to have Quinn build it. You can also click a suggested prompt such as Group leaderboard, Recent activity feed, or Courses by completion rate.
Step 3: Publish and Manage Your Dashboard
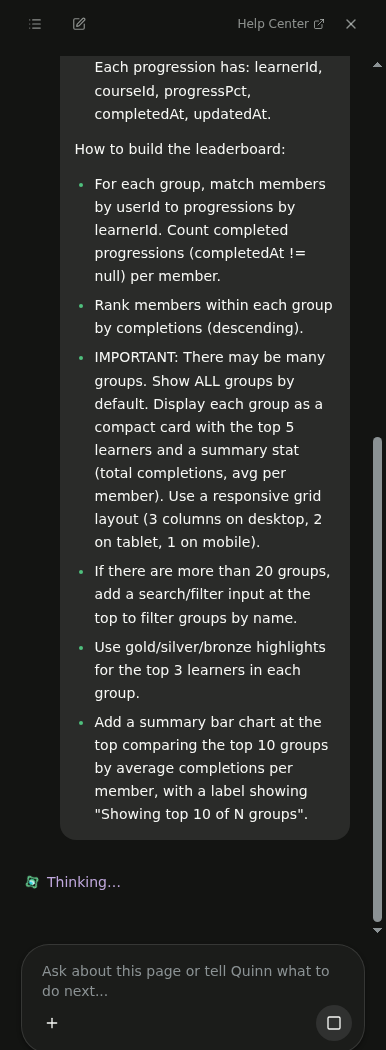
Quinn opens a chat panel and builds the dashboard, which starts as a Draft. When it looks right, Publish it so it appears for your team in the All Dashboards list. From that list, use each dashboard's menu to Open in Editor, Publish / Unpublish, or Delete it.
💡 Tip: This feature is in beta. Start from a suggested prompt if you're not sure what to ask — it's the fastest way to see what Quinn can build.
💡 Tips
Use the Group filter to spot which teams may need additional support or training.
Compare the Course filter across different courses to see which content is most effective.
For a deeper look at an individual's performance, go to the Course Report page.