Pre & Post Assessments
📌 Overview
The Pre & Post Assessments dashboard shows how much your learners' scores changed between a paired pre-assessment and post-assessment. Use it to prove the impact of a training, spot the trainings that aren't moving the needle, and drill all the way down to a single learner's answers before and after. It sits alongside your other dashboards in Analytics.
Step 1: Open the Analytics Dashboards
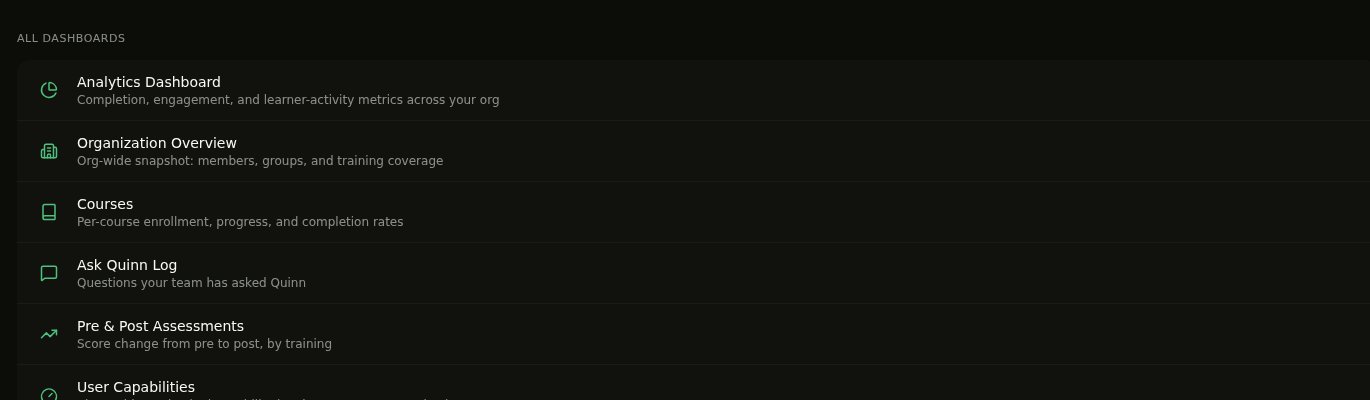
From the left sidebar, open Analytics. Under All Dashboards, click Pre & Post Assessments — described as Score change from pre to post, by training.
💡 Tip: If you see No measured improvement yet, no learner has finished both a pre and a post assessment yet — the dashboard only counts learners who completed both.
Step 2: Read the Score-Change Overview
The top of the dashboard summarises every paired training: Average score (pre → post), Average change in points, Trainings improved, and Flat or decreased. Change distribution below it groups learners into Lost points, No change, Gained 0–10 pts, Gained 10–20 pts, and Gained 20+ pts.
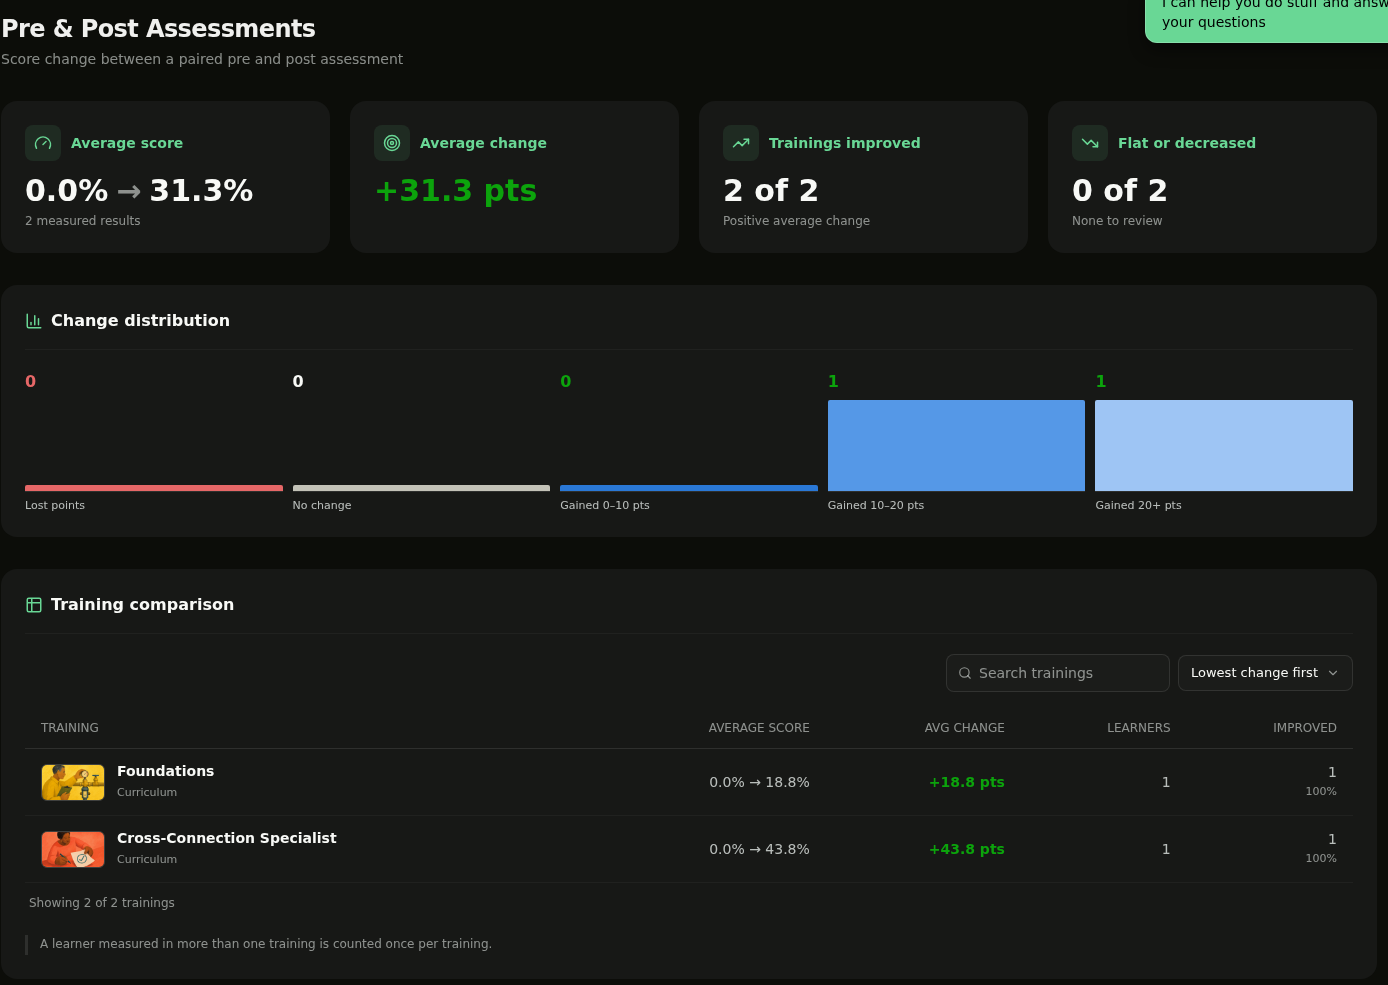
💡 Tip: Use Search trainings to filter the list, and switch the sort between Lowest change first, Highest change first, and Most learners first — start with the lowest change to find the trainings that need attention.
Step 3: Open a Single Training
In Training comparison, click any training row to open its detail view. You'll see Average score, Avg. change, and Learners improved for that training alone, plus its own Change distribution.
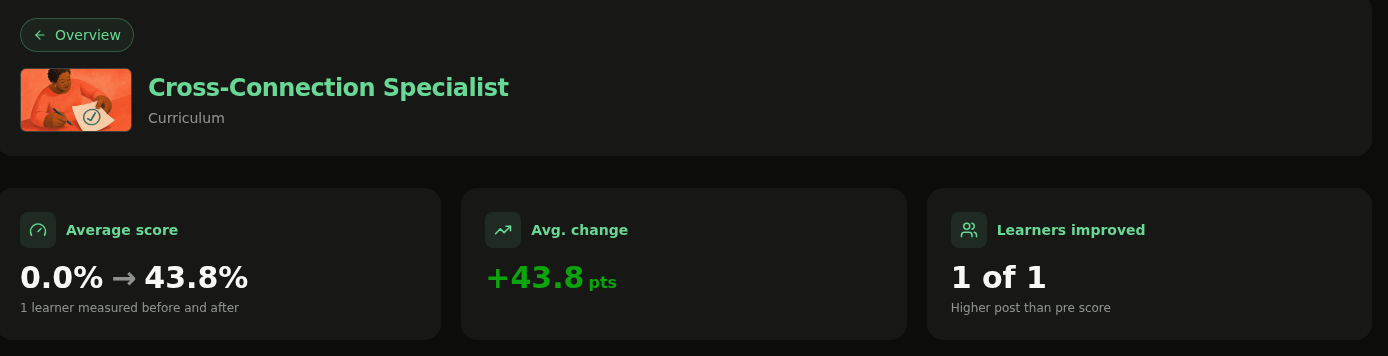
💡 Tip: Use the Overview link at the top-left to return to the full list of trainings.
Step 4: Compare Scores Question by Question
Scroll to Question comparison to see each question with its Pre avg, Post avg, and Change. Click any column header to re-sort, so you can bring the weakest-moving questions to the top.
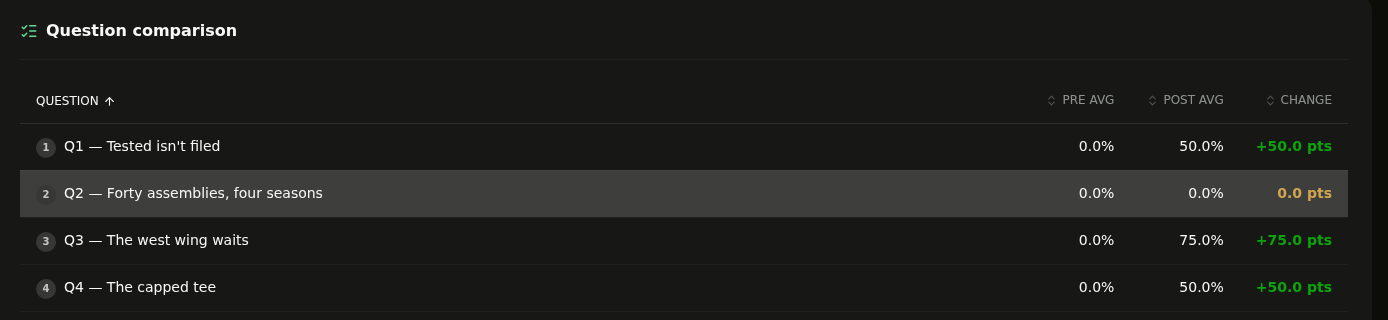
💡 Tip: A question with a 0.0 pts change is where your content isn't landing — that's usually the fastest place to improve the course.
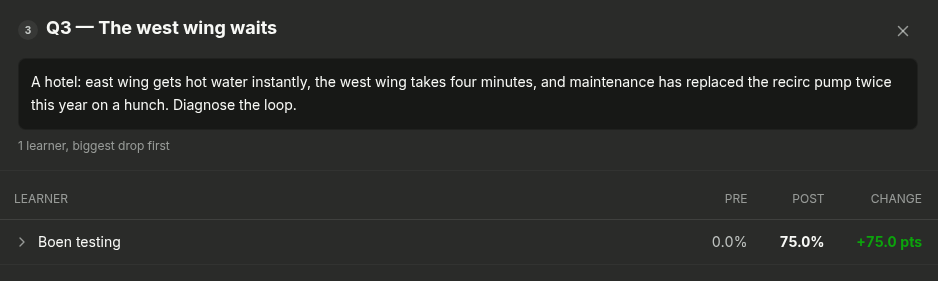
Step 5: See Every Learner on a Question
Click a question row to open a drawer showing the question as learners read it, followed by every learner's Pre, Post, and Change on that question, biggest drop first.
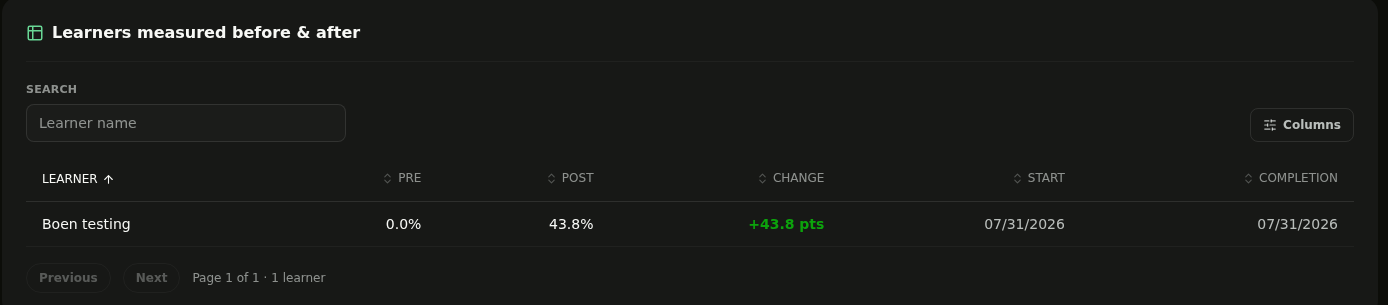
Step 6: Find a Learner
Under Learners measured before & after, search by Learner name to find someone, or use Columns to show or hide extra columns and Reset to defaults to undo your changes.
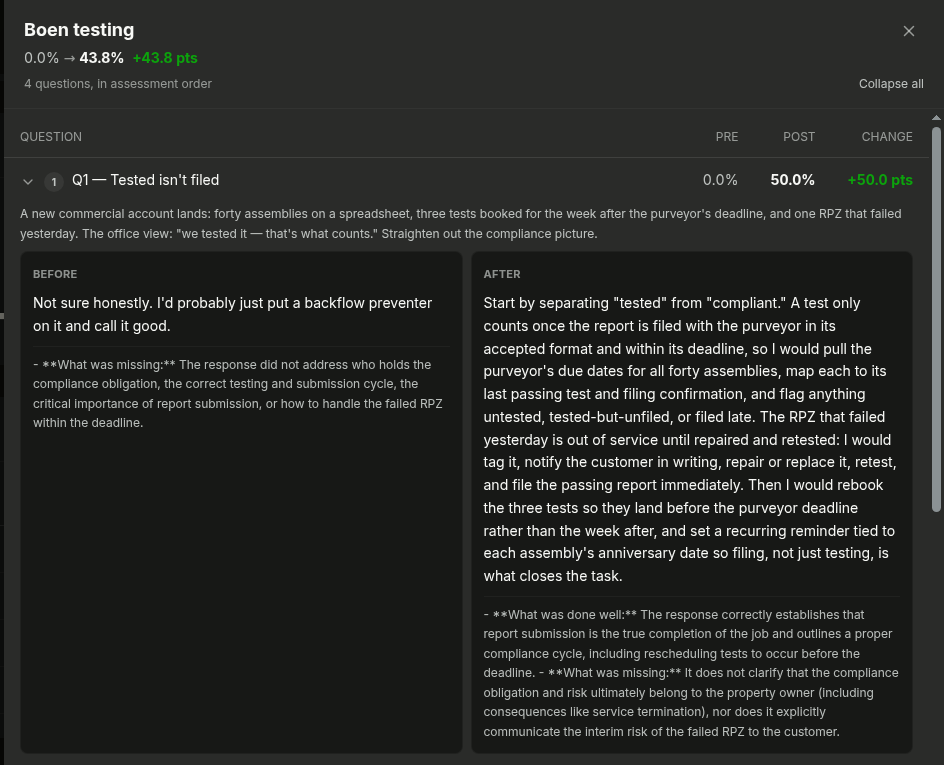
Step 7: Read One Learner's Submission
Click a learner row to open their submission drawer. Each question shows their score movement, and expanding it puts their Before and After answers side by side with the grader's feedback. Use Expand all or Collapse all to move through the whole assessment quickly.
💡 Tip: Where a learner left a question blank you'll see Skipped or No answer recorded instead of an answer.